NOTE: The following information is applicable only to Array type local variables.
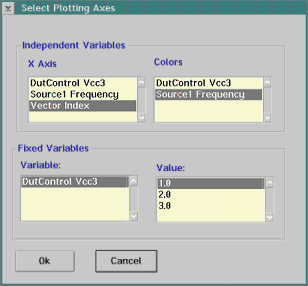
Viewing of array local variable data works like data save buttons except that it is also possible to view data for measurements which generate vector data. For example, Oscilliscope measurements generate a result which is not a single value, but a vector of voltages vs. time. For purposes of viewing, the vector data is treated as having an extra degree of freedom in addition to the dynamic instrument settings in the panel containing the measurement. The extra degree of freedom is treated as a dummy instrument setting called "Vector Index" for purposes of selecting axes in the Select Plotting Axes dialog box.
For example, in the following test, the output of the Channel 1 measurement is a vector of voltages measured vs. time. The test panel contains two dynamic instrument settings: "Source1 Frequency" and "DutControl VCC3".

The Select Plotting Axes dialog box appears when you click on the Array L.V. button to view the data for local variable named "arrayX". In addition to the "Source1Frequency" and "DutControl Vcc3" instrument settings, the X Axis list box also contains a dummy instrument setting called "Vector Index" which represent the index of the data in the vector output by the Channel 1 measurement. In the below dialog box, the user has selected to plot the the vector output by the Channel 1 measurement along the X Axis. The result for each frequency will be in a different color. And only the results for a DutControl Vcc3 value of 1.0 Volts will be display in the plot.


